From a new account to an answered question
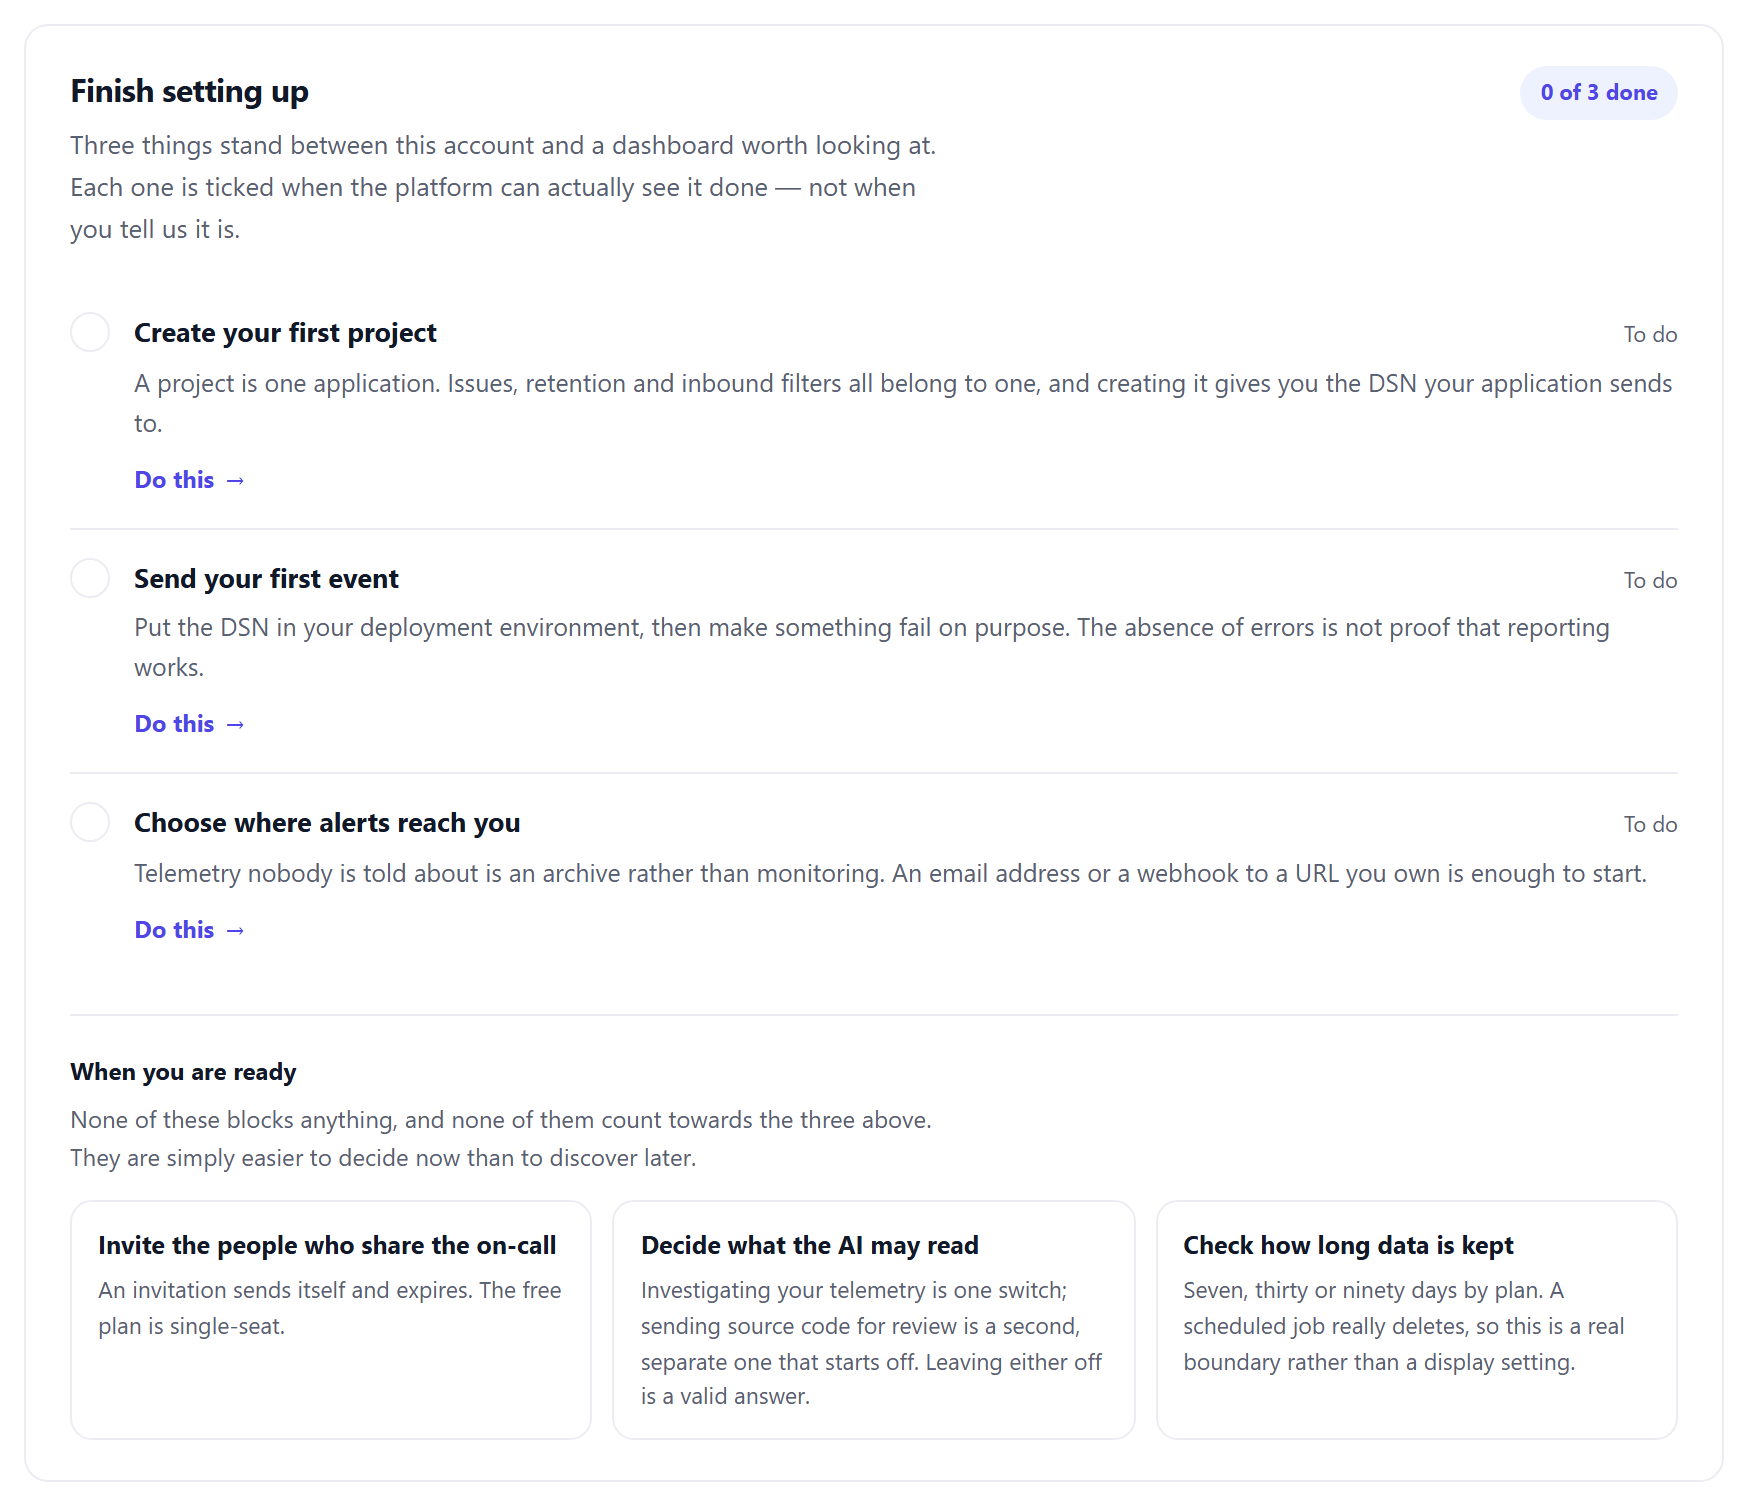
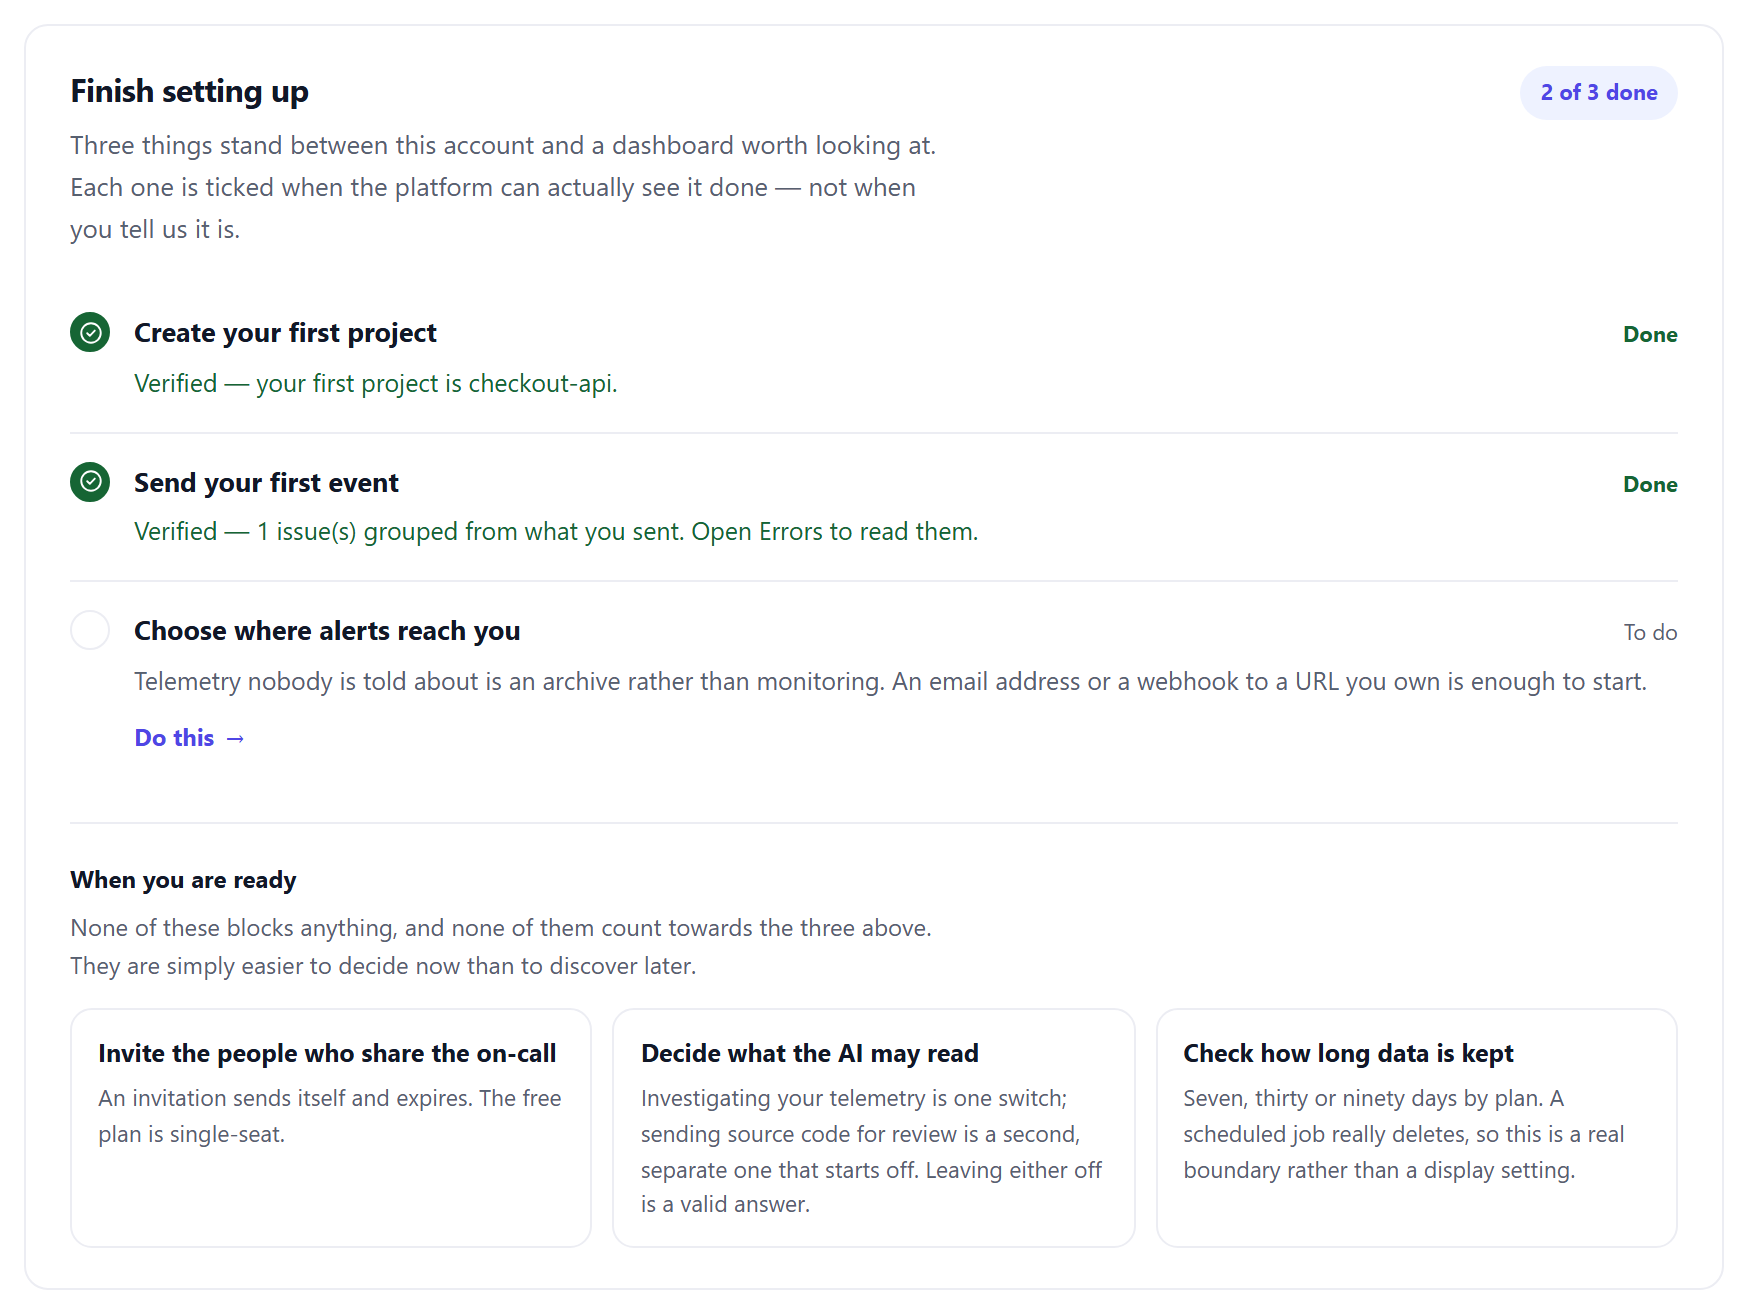
Three steps make the product work, and a handful of decisions make it work the way you want. This page is the whole path in order, with a picture of every step taken on a real account. Once you are signed in, the same three steps appear on your dashboard as a checklist that watches the platform rather than asking you — a step is ticked when we can actually see it done, not when you say so.
- 3
- steps before it is useful
- OTLP
- no proprietary agent to install
- No card
- the free plan needs no payment method
Before you start
You need an application that can make outbound HTTPS requests, and somewhere to put two environment variables. That is genuinely all — there is no agent to install, no sidecar to run and no daemon to keep alive.
There are three ways to connect, and which one is yours decides what you copy in Part 2. Read this table first; it is the decision the rest of the page assumes you have made.
| If you | Your way in |
|---|---|
| Already emit OpenTelemetry, or can add its SDK to your language | Part 3.A. You set an endpoint and one header and you are done. This is the path that works today for every language, and the one this page was tested with in Node.js, Python and Go. |
| Run an OpenTelemetry Collector already | Part 3.B. One exporter block in its YAML; nothing in the application changes. |
| Are instrumenting a browser front end | Part 3.C. Our own JavaScript SDK installs from npm and takes the whole DSN as one string, so you never split it. (The Go SDK is not installable yet; 3.C says so.) |
| Want a GitHub repository connected, or the command line | Parts 6 and 7. Neither sends errors; they add what changed, and readable stack traces. Do them after Part 4, when an error has already arrived. |
Step 1.1 — Create the account
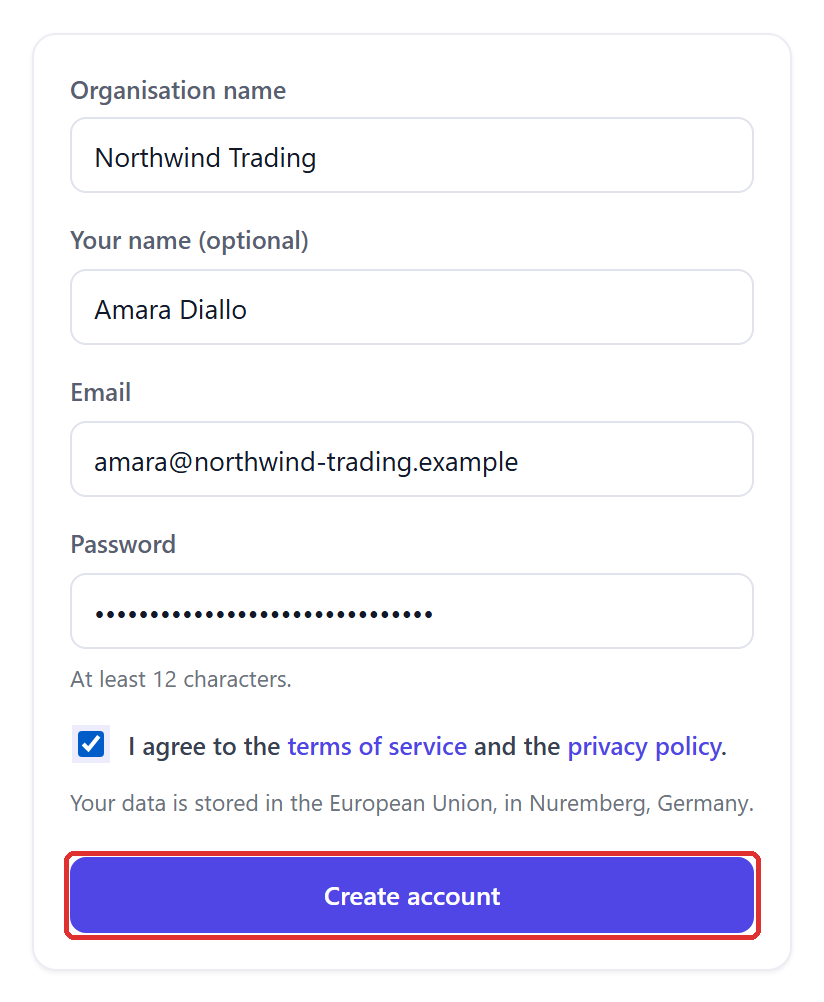
One form. The organisation name is the name your team will see in the top bar; it is not a domain and it does not have to be unique. Your own name is optional. The password must be at least 12 characters, and the terms and privacy policy are linked from the checkbox that accepts them.
No payment method is asked for, now or later on the free plan. The form also tells you where your data will live before you submit it.
snagspy.com → Get started → Create an account
Step 1.2 — Confirm your address
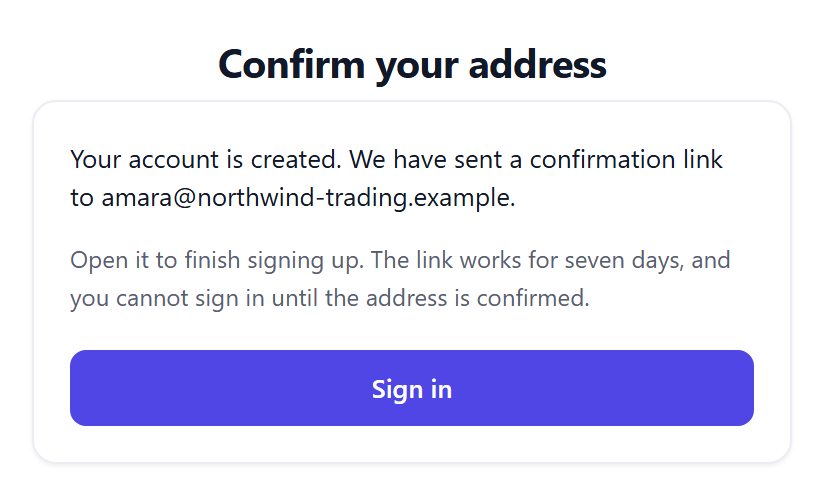
Submitting the form creates the account and sends one email, with the subject “Confirm your SnagSpy address”. The page replaces the form with a card that says where it went. Nothing else happens until you open that link: you cannot sign in with an unconfirmed address.
The link works for seven days. Asking for another replaces it, so if more than one has arrived, use the most recent. If none has, check the spam folder before anything else — the sender is [email protected].
Step 1.3 — Sign in
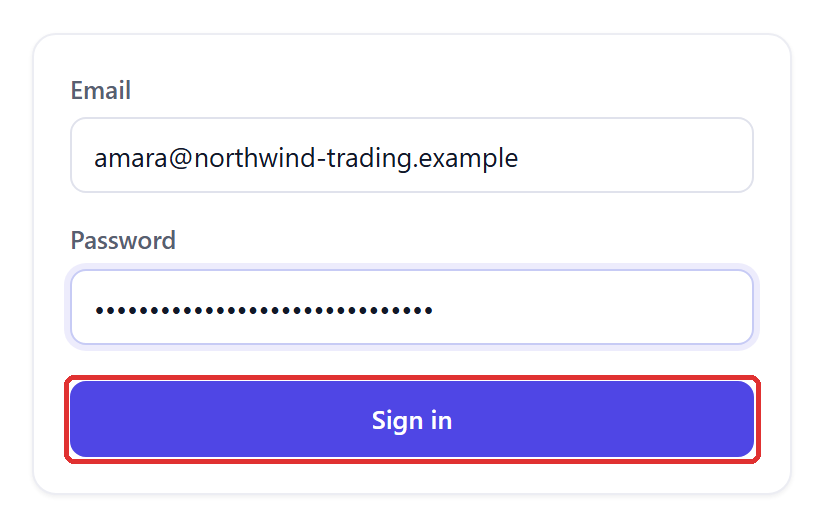
The address and the password from step 1.1. The first sign-in lands on the Overview page of your organisation, which for a new account is mostly the checklist in the picture at the top of this page.
snagspy.com → Sign in
Everything from here on happens inside the app, and every step names the sidebar entry it lives under. The sidebar is grouped — Monitoring at the top, Management near the bottom — and the two groups you will use most in this guide are Management, for setting things up, and Monitoring, for seeing what arrived.
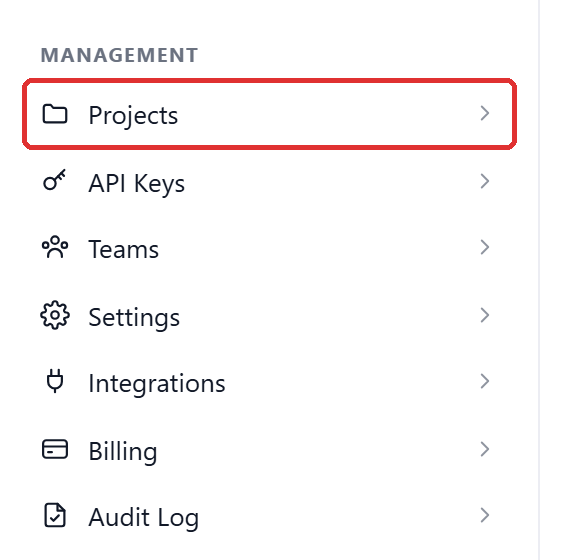
Step 2.1 — Open Projects
A project is one application. Issues, retention and inbound filters are all scoped to one, and creating one is what gives you a DSN — the address your application sends to. Most teams start with one and add another when a second service starts reporting.
Projects is under Management, which is the second-to-last group in the sidebar, not under Monitoring at the top. Scroll the sidebar if you do not see it.
Sidebar → Management → Projects
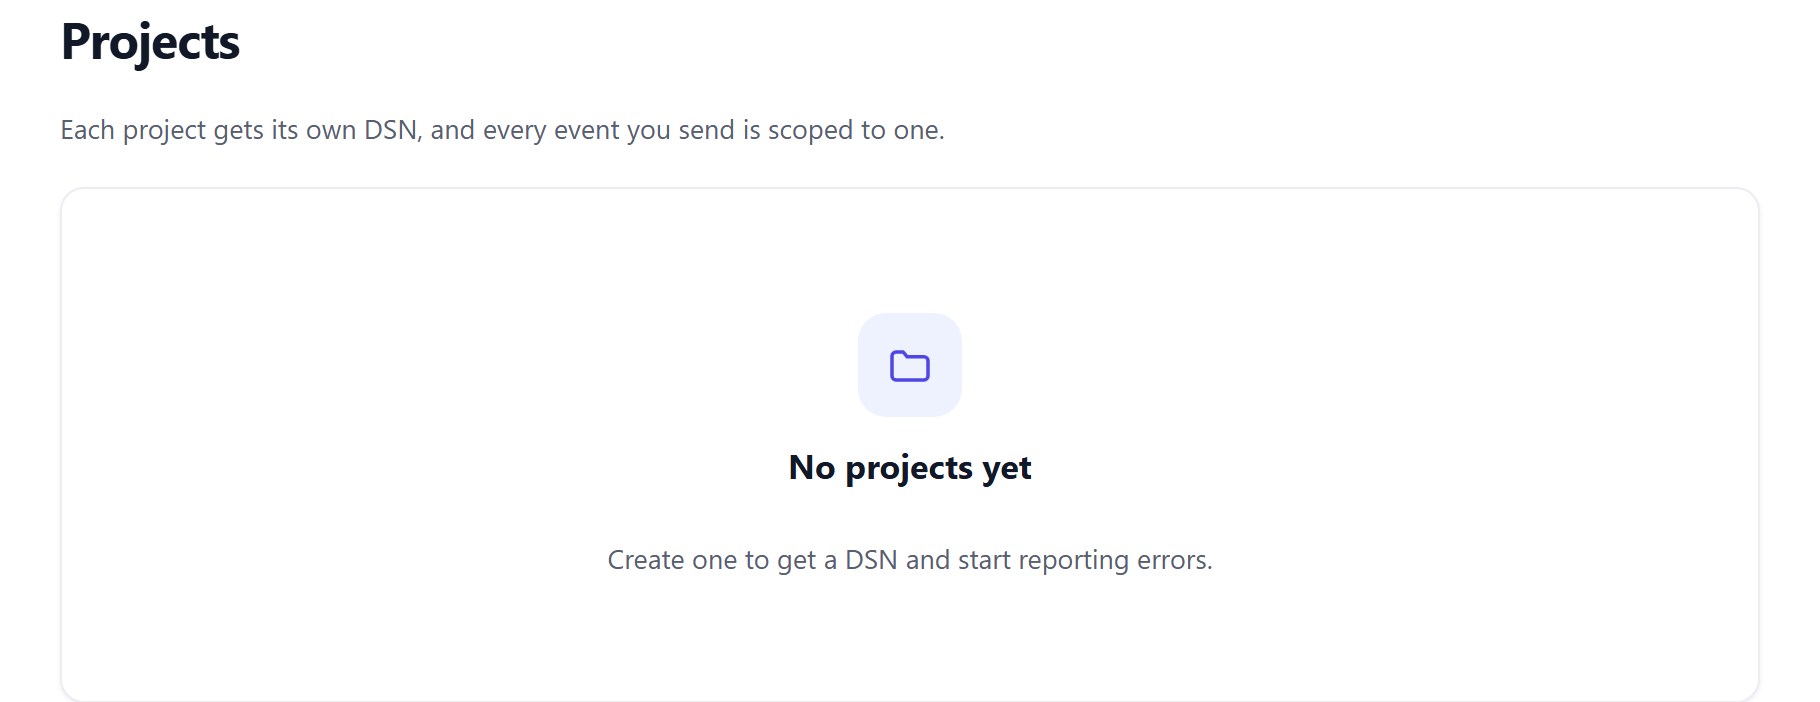
Step 2.2 — What an empty Projects page looks like
On a new account the page says so in as many words. Two cards: one telling you there is nothing yet, and a New project card with a single field. There is nothing to configure before creating one.
Sidebar → Management → Projects
Step 2.3 — Name it and create it
Name it after the application, not the environment — staging and production belong in one project, told apart by the deployment.environment attribute your SDK already sends. A name like checkout-api ages better than one like prod.
Type the name and click Create project. The project appears on the same page immediately, with no DSN yet.
Sidebar → Management → Projects → New project
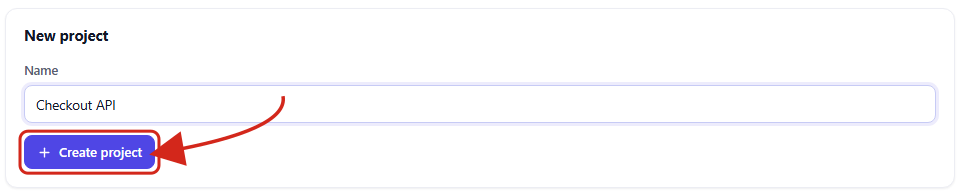
The checklist on your dashboard confirms this step by reading your project list. If it still shows Create your first project as to do, the project was not created — not merely unnoticed.
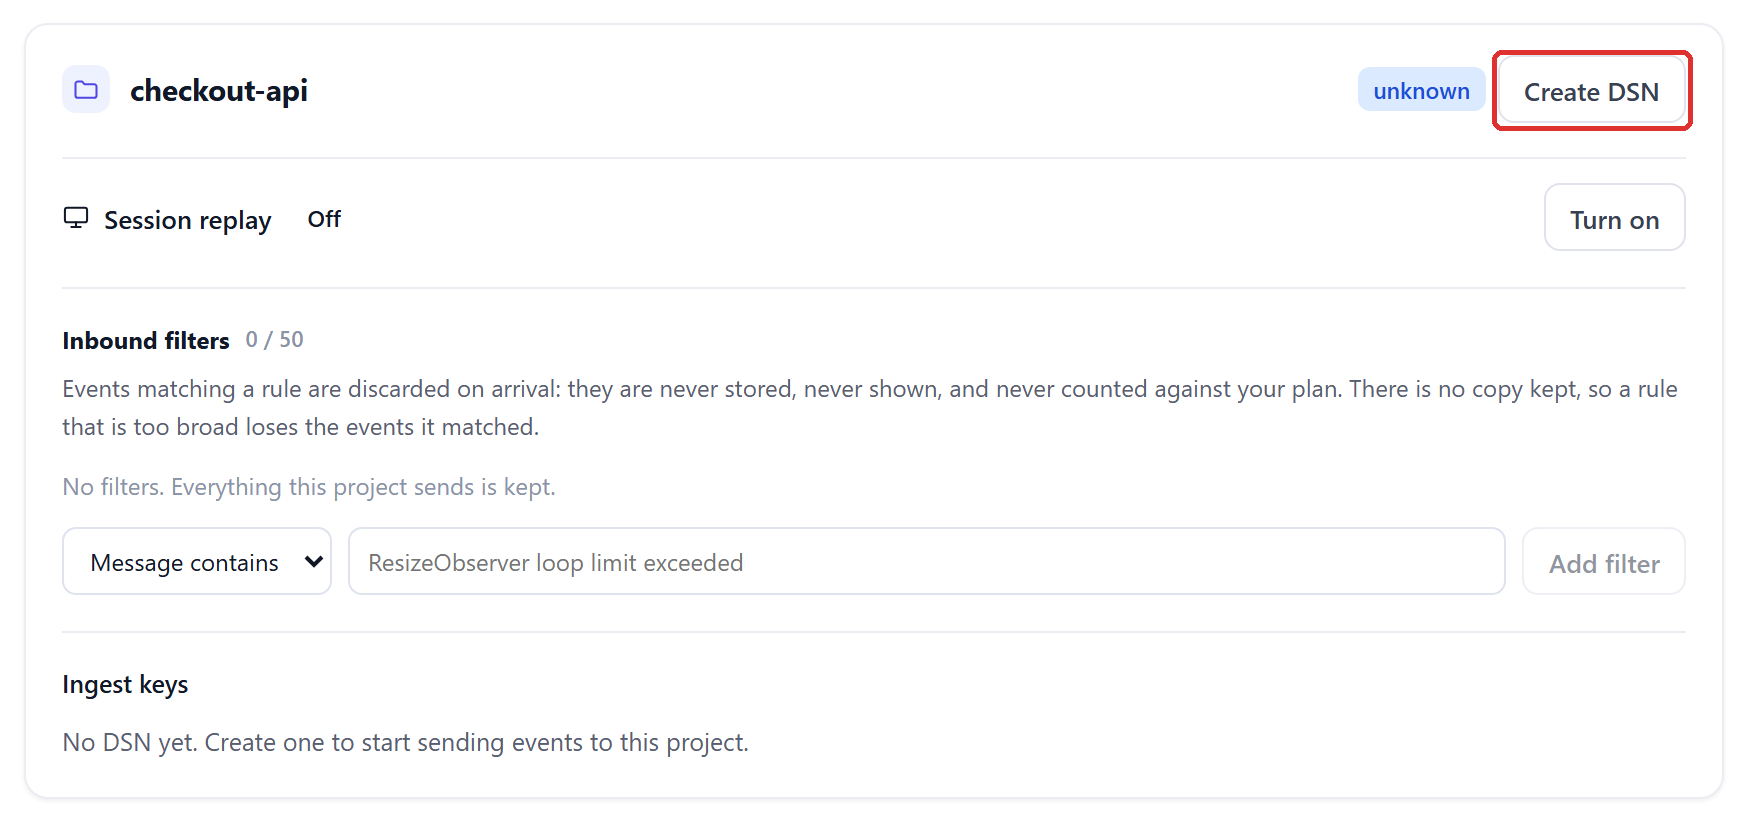
Step 2.4 — Create the DSN
The new project’s card says “No DSN yet” under Ingest keys. Nothing can send to a project until it has one, so this is the click that makes the project usable: the Create DSN button in the card’s top right.
You can have more than one DSN per project — one per deployment, say — and revoke any of them from this list later. Start with one.
Sidebar → Management → Projects → your project → Create DSN
Step 2.5 — Copy it now
Creating the DSN shows it in full, once, in a Your DSN box. Copy it before you leave the page. Afterwards the project lists only a shortened prefix — enough to tell two keys apart, not enough to send with. This was checked by reloading the page: the box is gone and the list shows the first ten characters.
Losing it is not a disaster — create another and revoke the first — but it is an avoidable detour. Paste it somewhere safe for now; step 2.6 says which part of it goes where.
Sidebar → Management → Projects → Create DSN (shown once, at creation)

Step 2.6 — Where to paste it, and which part
Into your application’s environment — wherever its other variables already come from: the env block of a container, a Kubernetes secret, your platform’s configuration variables, or a local .env file on a laptop. Not your repository and not your code, because the DSN differs between your projects and the code should not.
Paste it whole. You do not take it apart: the header variable accepts the entire string, and the other variable an OpenTelemetry SDK needs is the ingest host, which is the same constant for everyone and is printed in Part 3. Ingest also accepts the key on its own, so an older configuration that carries only the key keeps working.
It is a write-only credential. It permits sending telemetry into this one project and nothing else — never reading anything out — which is why the app calls it safe to embed in a client. It still belongs in your environment rather than in a public commit, because it differs between projects and your code should not.

| If you are using | You need |
|---|---|
| Any OpenTelemetry SDK — Part 3.A | The whole DSN in the Authorization header, and the host as the endpoint. The project is resolved from the key inside it, so nothing else is sent. |
| An OpenTelemetry Collector — Part 3.B | The same two: the DSN in the exporter’s headers and the host as its endpoint. |
| The command line — Part 7 | The PROJECT ID, as the --project argument when uploading source maps. This is the only place in the app the full id is shown, so keep the DSN for that reason too. |
| Our JavaScript SDK — Part 3.C | The whole string, as the dsn option. The SDK splits it and sets the header itself, so you never handle the key. |
Part 3 — Choose your way in
Ingest speaks standard OTLP over HTTP: traces at /v1/traces, logs at /v1/logs, metrics at /v1/metrics, as protobuf or JSON. Anything that exports OpenTelemetry can therefore send to it with two settings — the endpoint and one header — and that is what 3.A and 3.B are. There is no proprietary format to learn.
Whichever way you pick, the header is the part to get exactly right. It must be named Authorization, with the Bearer scheme. What it carries can be your whole DSN or just the key inside it — ingest accepts either and resolves the project from the key — so there is nothing to extract. What ingest will not accept is a header under any other name: that, a revoked key and a mistyped one are all refused with the same 401 and the same body, “DSN is invalid or revoked”, so the response cannot tell you which mistake you made. Part 4.4 can.
OTEL_EXPORTER_OTLP_ENDPOINT=https://ingest.snagspy.com
OTEL_EXPORTER_OTLP_HEADERS=Authorization=Bearer%20<your DSN, exactly as it was shown>
OTEL_SERVICE_NAME=checkout-api
The %20 is a space, percent-encoded, which is the form the OpenTelemetry specification asks for in that variable. A literal space also worked in the Node.js, Python and Go SDKs when this page was tested — both forms were sent with a whole DSN and all six combinations were accepted — so if you already have one, leave it. Whitespace around the value is trimmed on arrival.
Step 3.A.1 — Node.js
Two upstream packages and nothing of ours. The exporter reads the variables above from the environment, so the code names neither the host nor the key. This is the program that was run against a DSN minted in step 2.4; the issue it produced is the one in Part 4.
The shutdown call at the end matters more than it looks: the exporter batches, and a process that exits without flushing loses whatever it was holding — including the crash you most wanted to see.
import { NodeSDK } from '@opentelemetry/sdk-node'
import { OTLPTraceExporter } from '@opentelemetry/exporter-trace-otlp-http'
import { trace, SpanStatusCode } from '@opentelemetry/api'

const sdk = new NodeSDK({ traceExporter: new OTLPTraceExporter() })
sdk.start()

const tracer = trace.getTracer('checkout')
await tracer.startActiveSpan('POST /checkout/confirm', async (span) => {
  try {
    const order = undefined
    return order.total            // the deliberate failure
  } catch (err) {
    span.recordException(err)
    span.setStatus({ code: SpanStatusCode.ERROR, message: err.message })
  } finally {
    span.end()
  }
})

await sdk.shutdown()             // flush before the process exits
Step 3.A.2 — Python
The same shape with the upstream Python packages. record_exception is what turns the span into an error the dashboard groups; a span with ERROR status and no exception event is a slow request, not a crash.
from opentelemetry import trace
from opentelemetry.sdk.trace import TracerProvider
from opentelemetry.sdk.trace.export import BatchSpanProcessor
from opentelemetry.exporter.otlp.proto.http.trace_exporter import OTLPSpanExporter

provider = TracerProvider()
provider.add_span_processor(BatchSpanProcessor(OTLPSpanExporter()))
trace.set_tracer_provider(provider)

tracer = trace.get_tracer("checkout")
with tracer.start_as_current_span("POST /checkout/confirm") as span:
    try:
        order = None
        order["total"]                       # the deliberate failure
    except Exception as exc:
        span.record_exception(exc)
        span.set_status(trace.StatusCode.ERROR, str(exc))

provider.shutdown()                          # flush before the process exits
Step 3.A.3 — Go
Upstream modules only; nothing is fetched from our repository. RecordError attaches the exception event, SetStatus marks the span failed, and Shutdown flushes.
exporter, err := otlptracehttp.New(ctx)
if err != nil {
    log.Fatal(err)
}
provider := sdktrace.NewTracerProvider(sdktrace.WithBatcher(exporter))
otel.SetTracerProvider(provider)
defer provider.Shutdown(ctx)                 // flush before the process exits

_, span := otel.Tracer("checkout").Start(ctx, "POST /checkout/confirm")
err = errors.New("order total is nil")     // the deliberate failure
span.RecordError(err)
span.SetStatus(codes.Error, err.Error())
span.End()
Step 3.A.4 — Any other language
Every OpenTelemetry SDK — Java, .NET, Ruby, PHP, Rust and the rest — reads the same three variables from Part 3 and sends to the same three paths. Install the OTLP/HTTP exporter for your language, set the variables, record an exception on a span, and go to Part 4. Only Node.js, Python and Go were executed for this page; the others follow the same specification but were not run here.
If your SDK is configured in code rather than from the environment, the two values are the endpoint https://ingest.snagspy.com and a headers map with one entry: Authorization set to Bearer, a space, and the KEY.
Step 3.B — A collector you already run
Add one exporter and put it on the pipelines you want mirrored. The application does not change at all. In YAML no percent-encoding applies, so the header is written with a real space.
Keep your existing exporter on the same pipeline while you compare the two. The OpenTelemetry guide in the documentation has the full side-by-side configuration.
exporters:
  otlphttp/snagspy:
    endpoint: https://ingest.snagspy.com
    headers:
      Authorization: Bearer ${SNAGSPY_DSN}

service:
  pipelines:
    traces:
      receivers: [otlp]
      exporters: [otlphttp/snagspy]
Step 3.C — Our own SDK, for a browser application
If what you are instrumenting is a front end, this is the shortest path of the three: our JavaScript SDK takes the whole DSN as one string and does the splitting itself, so nothing in your code touches the key or the endpoint. It also installs the handlers for uncaught errors and unhandled promise rejections, so the common case needs no call site at all, and it redacts secret-shaped values before anything leaves the browser.
The Go SDK is the one exception on this page, and it is stated rather than glossed: its module path, github.com/snagspy/sdk-go, does not exist as a repository yet, so `go get` answers 404 (checked 11 Sep 2026). Go fetches source from the path itself and the platform repository is private, so the SDK needs a public one of its own. For Go, use Part 3.A.3 — it reaches the same dashboard with upstream packages, and it is the sample this page actually ran.
import { init } from '@snagspy/replay/errors'

// The whole DSN from step 2.5, exactly as it was shown.
const snagspy = init({ dsn: globalThis._importMeta_.env.VITE_SNAGSPY_DSN })

snagspy.captureException(new Error('first error from the browser'))
The package is ESM and ships its own TypeScript declarations. Session replay and user feedback are separate entry points of the same install, documented on the browser JavaScript page.
Step 4.1 — Make something fail on purpose
Do not take the absence of an error as success. Deploy the change from Part 3, then cause one failure you can recognise: throw on a route you can reach, run a request you know returns 500, or run the sample program as it is — its deliberate failure is labelled in the code.
Then wait a few seconds. The exporter batches, so an event leaves the process on the batcher’s schedule or at shutdown, whichever comes first.
Step 4.2 — Open Errors
Errors is under Monitoring, at the top of the sidebar. The event appears as one row: the exception type and message, the frame it came from, how many events and how many users, and when. Events are grouped into issues by where they came from, not by how many arrived — a second identical failure joins this row rather than adding one.
Sidebar → Monitoring → Errors

Step 4.3 — The checklist agrees
Back on Overview, the first two rows are now ticked, and each says what it saw: the project by name, and how many issues were grouped from what you sent. This is the step the dashboard proves rather than assumes — it reads your usage for the current period and ticks only when the event counter has actually moved above zero.
Sidebar → Monitoring → Overview
Step 4.4 — If nothing arrived
First separate “my request never landed” from “it landed and was refused”. The ingest host answers a liveness check without any credential; if that fails from the machine your application runs on, the problem is egress — a firewall or proxy — and no amount of configuration will fix it.
If the check answers, the request landed and the causes are, in order of how often they happen: the header is not named exactly Authorization with the Bearer scheme; the key was revoked or belongs to a different project; the value was truncated when it was copied; or the exporter buffered and the process exited before it flushed. The first three produce the identical 401 shown below, so check all three rather than stopping at the first.
curl -i https://ingest.snagspy.com/healthz
# HTTP/1.1 200 OK  {"status":"ok"}        — the host is reachable from here

curl -i -X POST https://ingest.snagspy.com/v1/traces \
  -H "Content-Type: application/json" -H "Authorization: Bearer <your DSN>" -d "{}"
# 200 {}                                    — accepted; the problem is in your exporter
# 401 {"error":{"code":"invalid_dsn",...}}  — wrong header name, or a wrong or revoked key
Two things are not causes, because both were checked by sending them: spaces around the value, which ingest trims, and pasting the whole DSN where you might expect only the key to go, which ingest accepts.
Step 5.1 — Choose where alerts reach you
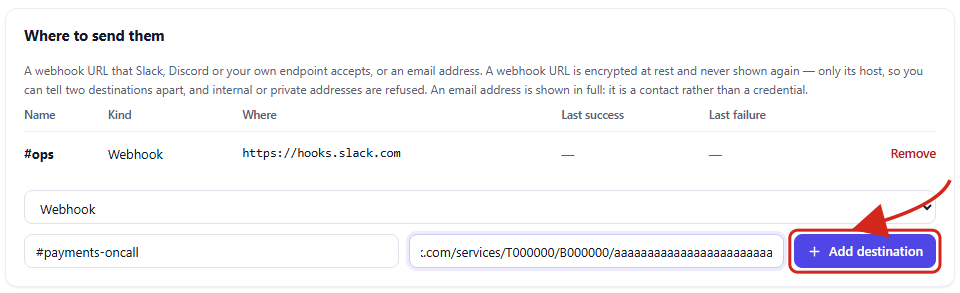
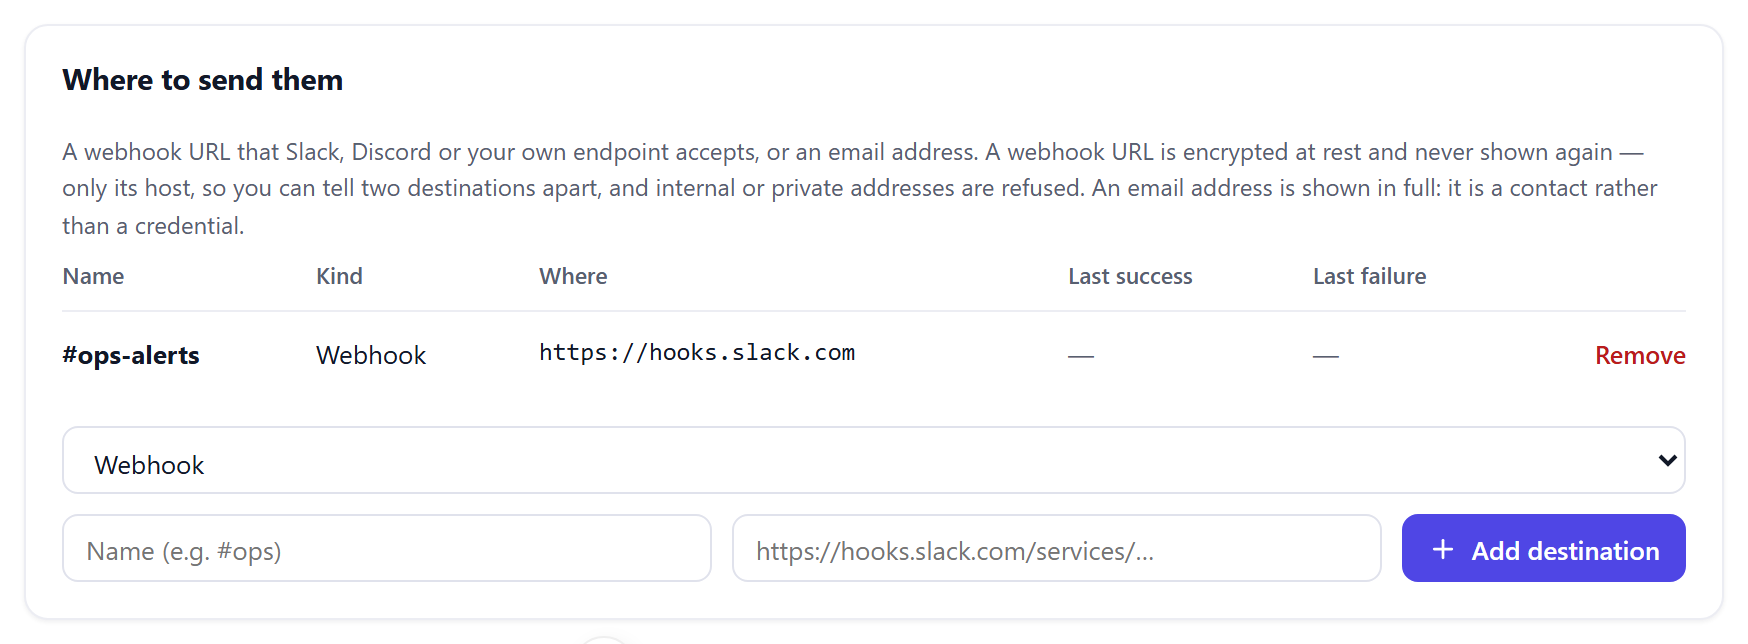
Telemetry nobody is told about is an archive, not monitoring. Alerts is under Monitoring; the Where to send them card at the bottom of the page takes either a webhook URL — Slack and Discord incoming webhooks work as they are — or an email address. Pick the kind, name it, paste the URL or the address, and click Add destination.
The webhook address is checked before it is saved: an internal or private network address is refused. Alert mail and digests arrive in the language set on the organisation, which is worth setting in Part 9 if your on-call rota does not read English.
Sidebar → Monitoring → Alerts → Where to send them
Step 5.2 — What is kept afterwards
The saved row shows the name, the kind and the host — https://hooks.slack.com — and never the full webhook URL again, because that URL is a credential and is stored encrypted. An email address is shown in full, because it is a contact rather than a credential. Last success and Last failure fill in as alerts are delivered.
Sidebar → Monitoring → Alerts → Where to send them
Step 6.1 — What connecting GitHub does, and does not do
Connecting a repository does not send errors; the SDK from Part 3 does that. What it sends is deployments: a push to the repository’s default branch is recorded as a production deployment whose release is the commit it landed on, with the commit message, the author and a compare link. That is what lets the platform answer “what changed?” — an error that began three minutes after a deploy sits next to that deploy on the timeline, and root-cause analysis reads the same timeline.
It is a webhook from GitHub to us, signed with a secret you choose, and it is set up per project. The platform holds no GitHub credential of its own and fetches nothing from your repository. Pushes to other branches are accepted and ignored, so a feature branch never appears as a release.
Slack and Discord are not on this page and are not missing: they receive alerts, which is Part 5. A provider here sends deployments in, which is why the form asks for a signing secret.
Step 6.2 — Choose a signing secret
The secret is a string you invent and enter in two places — here and on GitHub — so that we can verify each delivery really came from your repository. It must be at least 16 characters; a short one makes the signature brute-forceable from a single captured delivery. Generate a random one and keep it in a password manager until step 6.6, because SnagSpy will not show it again.
openssl rand -hex 24Step 6.3 — Fill in the Connect a provider card
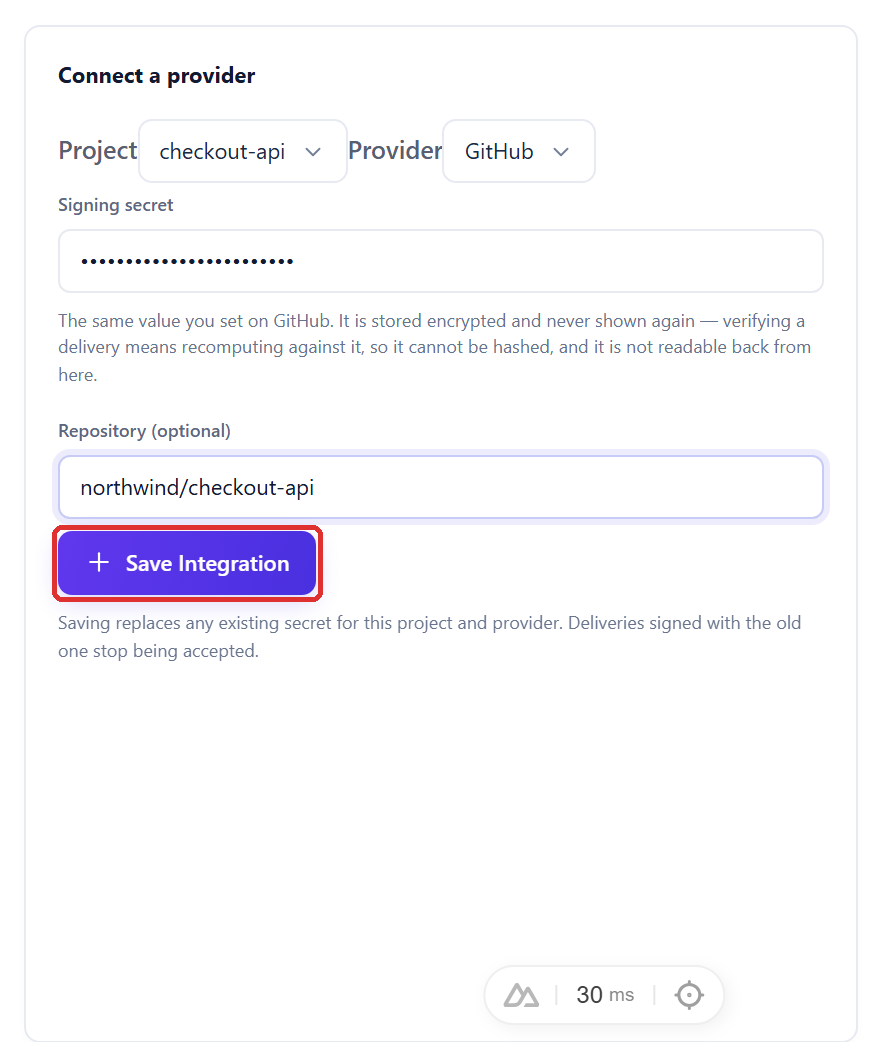
Integrations is under Management. The card on the right asks for the project, the provider — GitHub — the signing secret from step 6.2, and optionally the repository name, which is only a label to tell rows apart. Click Save Integration.
Saving replaces any secret already stored for this project and provider, and deliveries signed with the old one stop being accepted. Only an owner or admin sees this card.
Sidebar → Management → Integrations → Connect a provider
Step 6.4 — Copy the delivery URL
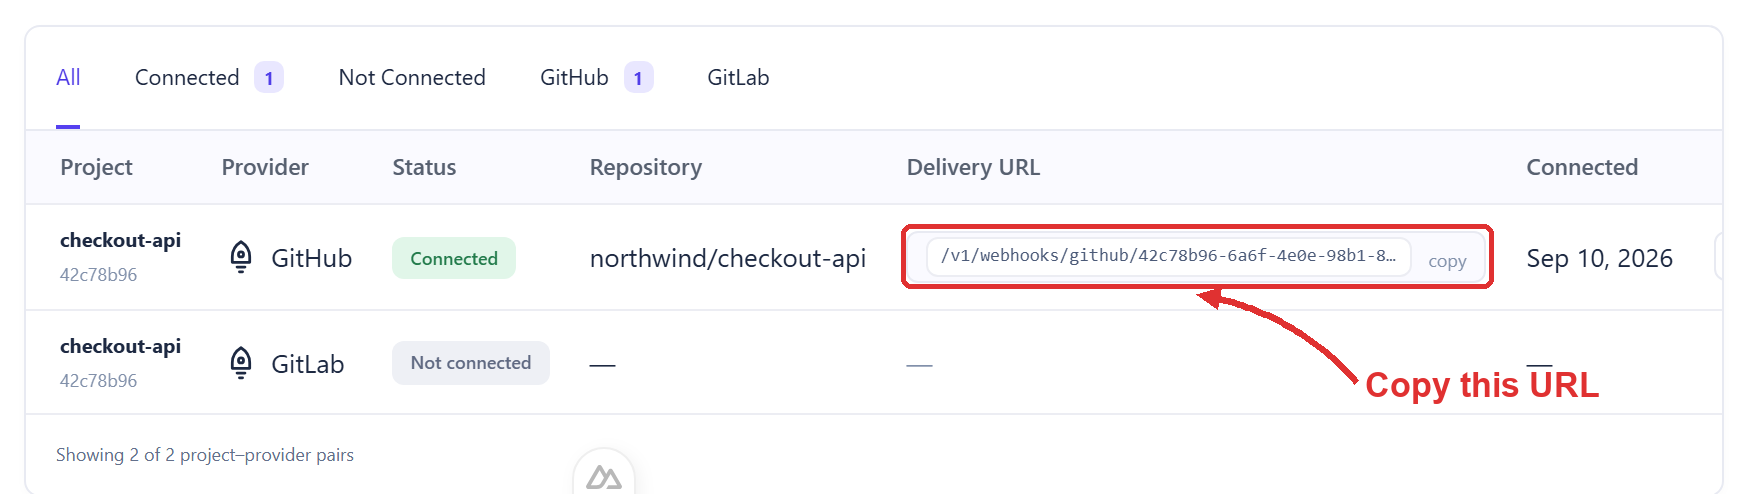
The table now has a Connected row for GitHub, and its Delivery URL column holds the address GitHub must post to. Click it to copy. It ends in your project id, so it is different for every project and is not a secret — the signature is what proves the sender.
The cell shows the path; the full address is that path on https://api.snagspy.com, which is what the copy button puts on the clipboard.
Sidebar → Management → Integrations → the row for your project
Step 6.5 — Where it goes on GitHub
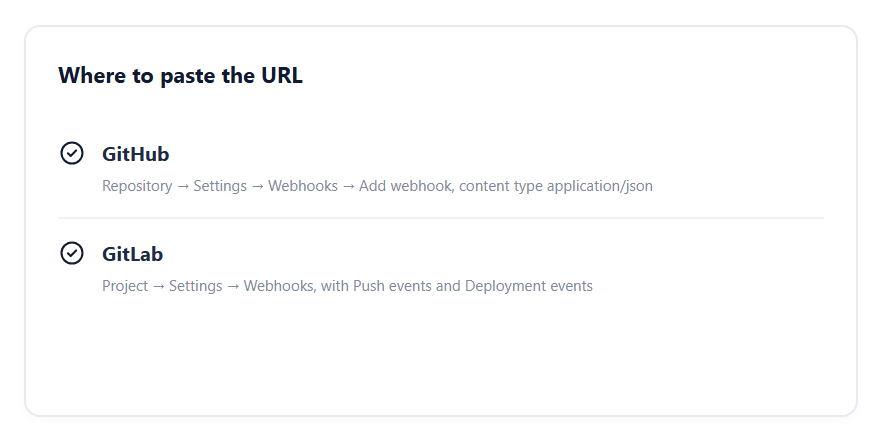
The card beneath the form on the Integrations page says it in one line, and it is the same for every repository: open the repository on GitHub, then Settings → Webhooks → Add webhook. You need to be an administrator of the repository to see that page.
Sidebar → Management → Integrations → Where to paste the URL
Step 6.6 — Fill in GitHub’s form
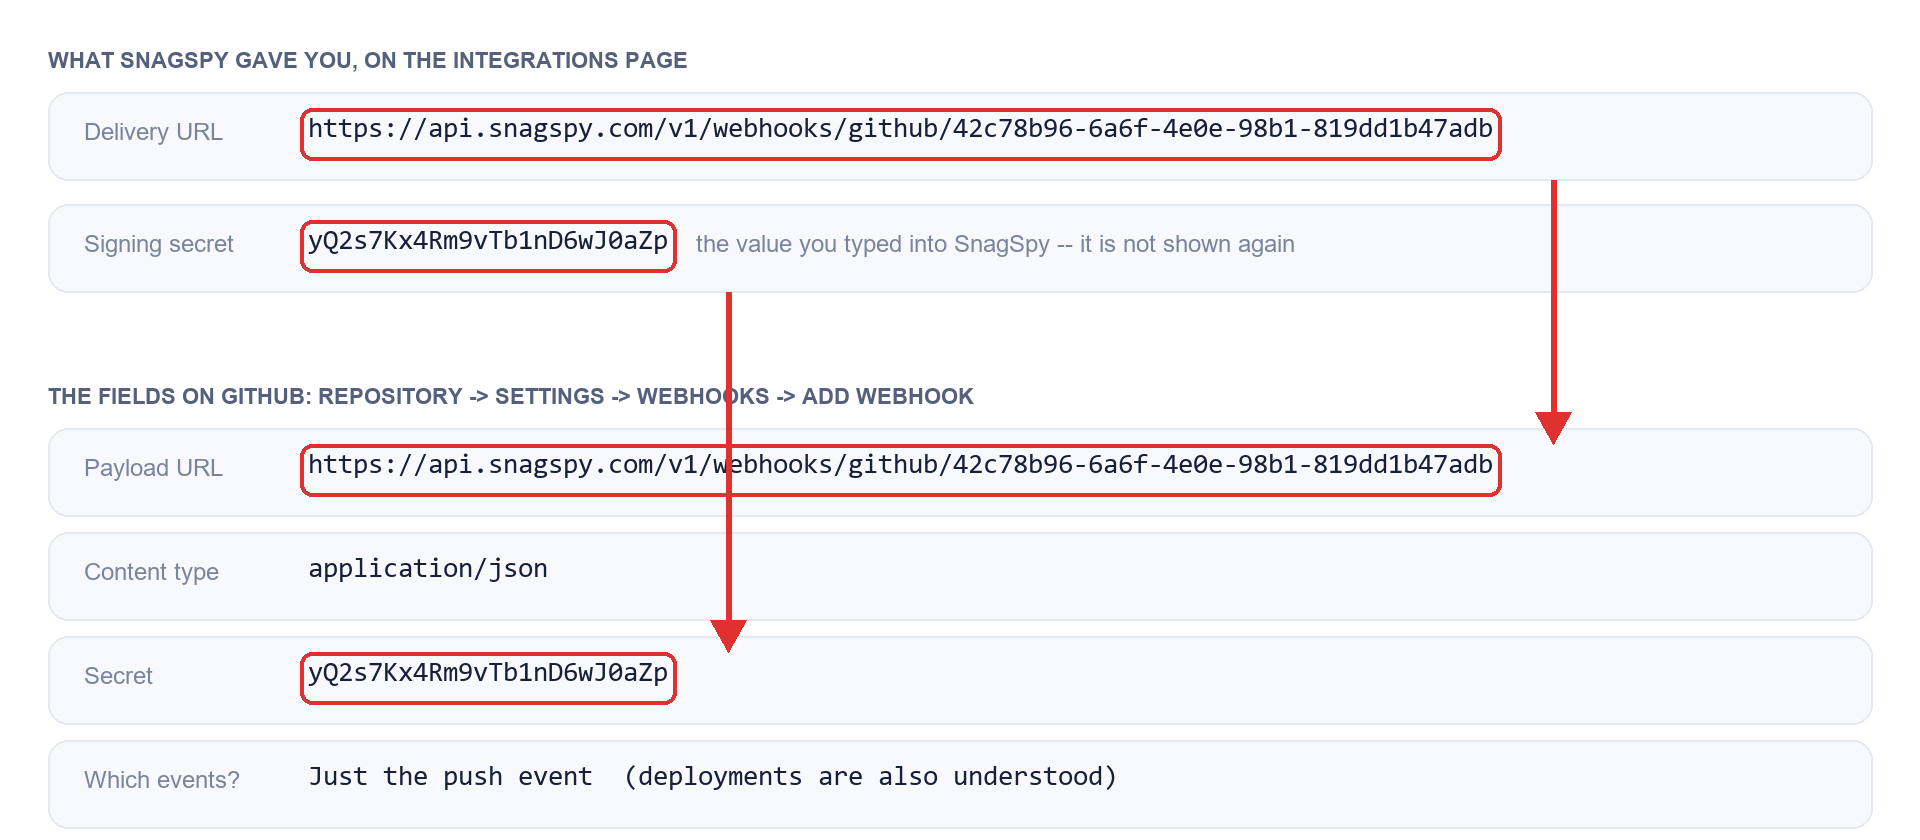
Four fields matter. Payload URL is the delivery URL from step 6.4. Content type must be application/json — the other option sends a form encoding the signature is not computed over. Secret is the string from step 6.2, exactly as you typed it into SnagSpy. For events, “Just the push event” is enough; if your pipeline uses GitHub Deployments, those are understood too and add an environment.
Click Add webhook. GitHub sends a ping delivery immediately, and SnagSpy answers it with 200 — that is what turns the tick green under Recent Deliveries on GitHub’s page.
Step 6.7 — Confirm it, and what to expect afterwards
On GitHub, the webhook’s Recent Deliveries tab lists the ping with a green tick and a 200. A red cross with a 401 means the secret differs between the two places — retype it on GitHub, or save a new one on both sides. The response body does not say which side is wrong, deliberately: telling an unauthenticated caller whether a project has an integration is something we refuse to do.
The next push to the default branch appears under Deployments in the sidebar within seconds, and under Releases as the commit it landed on. From then on every issue carries the release it first appeared in.
Step 7.1 — What the command line is for
One npm package, snagspy, does three jobs: it uploads the source maps that make a minified stack trace readable, it sends a change for review, and it serves your telemetry to a coding agent over MCP. It does not send errors — that remains Part 3 — so it comes after an event has already arrived.
It is published and installs normally; it needs Node 20.19 or newer. It authenticates with an API key rather than a DSN, and the key is scoped: the one you make for a build pipeline can upload source maps and cannot read a single event.
Step 7.2 — Create an API key with one scope
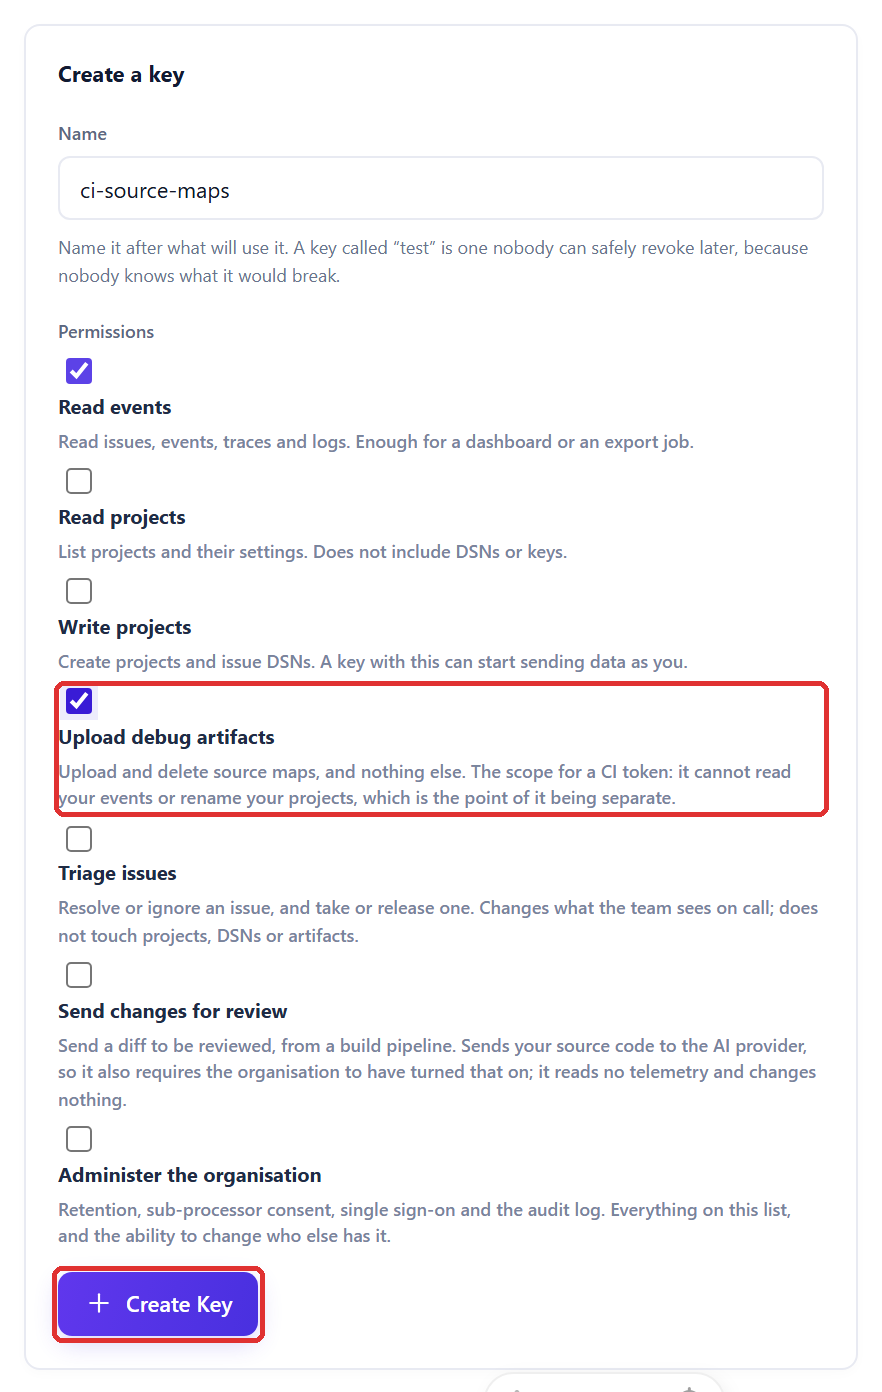
API Keys is under Management. Name the key after what will use it — a key called “test” is one nobody can safely revoke later — and tick only the scope that job needs. For uploading source maps that is Upload debug artifacts; the card says in so many words that it cannot read your events or rename your projects, which is the point of it being separate.
Sidebar → Management → API Keys → Create a key
| Command | Scope it needs |
|---|---|
| snagspy upload | Upload debug artifacts (artifacts:write) |
| snagspy review | Send changes for review (code:review) |
| snagspy mcp | Read events (events:read), plus Triage issues (issues:write) to set an issue’s status |
| snagspy whoami | Any |
Step 7.3 — Copy the key now
The key is shown once, in a highlighted box, with a Copy key button. The platform stores a hash of it, so it cannot be shown again; if it is lost, revoke it and issue another. The list afterwards shows only the prefix, which is how you tell keys apart.
Sidebar → Management → API Keys → just after Create Key

Step 7.4 — Install it and check who you are
The CLI reads the key from SNAGSPY_TOKEN. There is a --token flag you should prefer not to use: an argument is visible to anything that can list processes, and it lands in shell history. whoami prints the organisation the key belongs to and the scopes it carries, and nothing else, so it is the command to run when something is refused and it is safe to paste into a bug report.

export SNAGSPY_TOKEN=slk_...        # the key from step 7.3
npx [email protected] whoami            # or: npm install -g snagspy
Step 7.5 — Upload source maps from your build
A minified stack trace names t.js:1:4821, which tells nobody anything. Uploading the maps for a release turns it back into the file and line somebody wrote. Run this in the build, after the bundler and before the deploy, with the PROJECT ID from step 2.6 and the same release name your application reports.
Always pass --release. A map uploaded without one cannot be matched to the build that produced the error, and an unresolved stack looks exactly like one from a release you never uploaded maps for.
snagspy upload --project <PROJECT ID> --release v1.4.2 ./dist

snagspy upload: 1 sent, 0 skipped, from ./dist
Step 7.6 — Put your telemetry inside your coding agent
snagspy mcp serves your organisation’s telemetry over MCP on stdio, which is what Claude Code, Cursor and the other agent clients speak. The agent editing a file can then ask what is actually failing in production instead of you pasting a stack trace into a chat. Same package, a key with Read events and, if you want it to set statuses, Triage issues.
{
  "mcpServers": {
    "snagspy": {
      "command": "npx",
      "args": ["-y", "[email protected]", "mcp"],
      "env": { "SNAGSPY_TOKEN": "slk_..." }
    }
  }
}
Step 8 — Invite the people who share the on-call
Teams is under Management. An address and a role: a member reads telemetry and triages issues; an admin can additionally create projects, issue DSNs and upload debug artifacts; an owner can also invite, remove, change roles, read the audit log and configure single sign-on.
Seats are checked when an invitation is issued and again when it is redeemed. The free plan is single-seat, so a second person means a paid plan. The invitation is bound to the address it was sent to and expires; a forwarded link is not enough to join under it.
Sidebar → Management → Teams → Invite a colleague

Step 9.1 — Decide what the AI may read
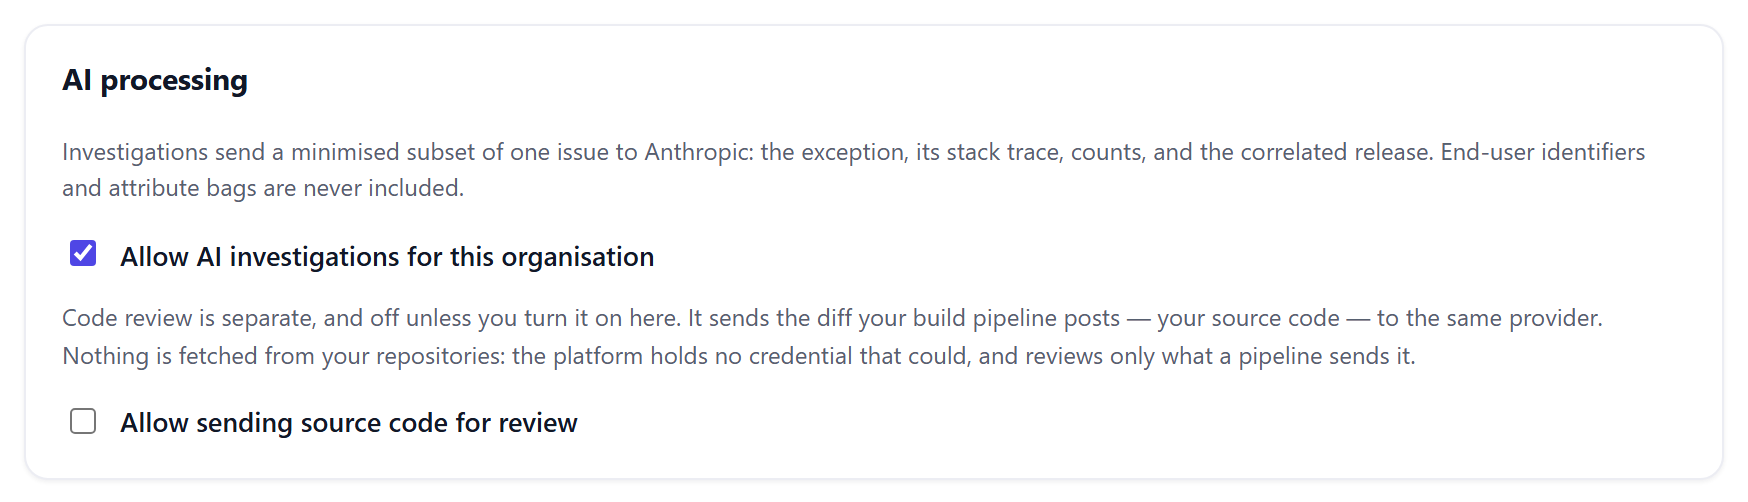
Settings is under Management. AI investigation of one issue is one switch, per organisation, and the card says exactly what an investigation sends: the exception, its stack trace, counts and the correlated release, never end-user identifiers or attribute bags. Sending source code for review is a second, separate switch that starts off, and it reviews only the diff a pipeline posts — nothing is fetched from your repositories, because the platform holds no credential that could.
Leaving either off is a valid answer, and the product keeps working.
Sidebar → Management → Settings → AI processing
Step 9.2 — Check how long data is kept
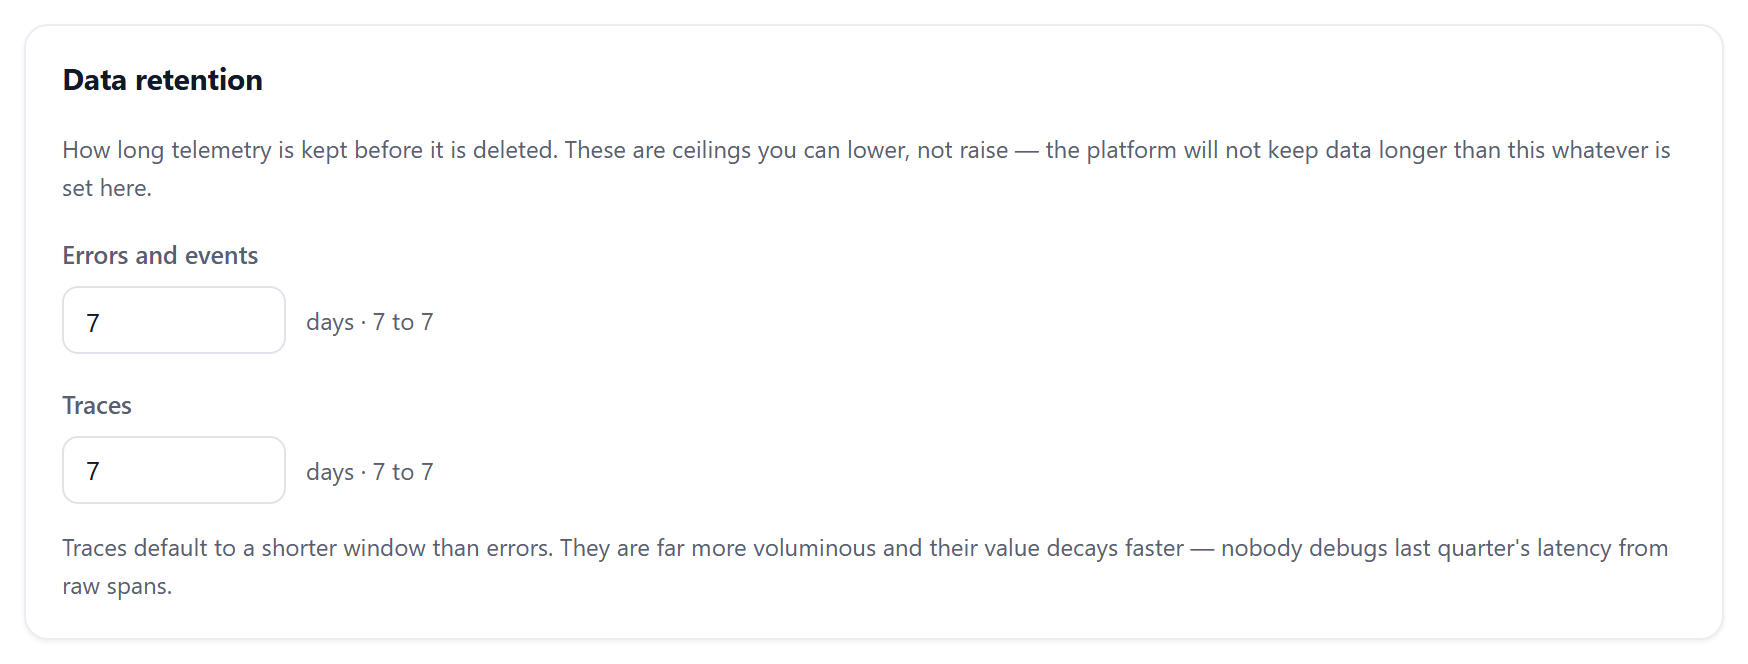
Retention is a ceiling by plan — seven days on the free plan for both errors and traces, as the card shows — that you can lower and not raise. A scheduled job really deletes and the ceiling is applied again at read time, so this is a real boundary rather than a display setting. Seven days is deliberately too short to run an on-call rotation on; it is enough to see the product work.
The language alerts arrive in
Also on this page. It is a property of the organisation rather than of your account, because an alert often goes to somebody who is not the one who set it up.
What never gets stored
Inbound filters, on the project card from step 2.4, drop events at ingest after scrubbing and before storage, so a filtered event is never written and never counted. Every rule shows what it removed.
Single sign-on
Any OpenID Connect provider — Google Workspace, Microsoft Entra, Okta, Auth0 — from the same settings page, once you have more than one person.
Sidebar → Management → Settings → Data retention
What a finished setup looks like
- A project exists, and its KEY is in your deployment environment rather than your repo.
- Your event counter for this period is above zero, and you have seen a real error in the Errors list.
- At least one alert destination exists, and the checklist on Overview has removed itself.
- A push to your default branch shows up under Deployments, if you connected GitHub.
- A CI key with one scope uploads source maps, if you ship minified JavaScript.
- Everyone who might be woken up has an account.
- The AI and retention settings say what you meant them to say, rather than whatever they defaulted to.
If something is not working
The two health endpoints on the status page answer without authentication, so you can tell a platform problem from a configuration problem before you write to anyone. Step 4.4 has the two commands that separate the common causes.
If it is a configuration problem, [email protected] is read by the people who built this. Include the project name and roughly when you sent the event that did not arrive.
Start at step 1.1
Creating an account takes a form and no payment method. The checklist appears on your dashboard the moment you arrive, and disappears on its own once the three steps are done.